-
 Why We’re Here: The Health of Northern Ireland in Numbers - 2026Download pdf

Statistics
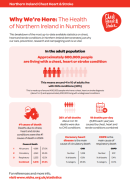
The most up-to-date, available, statistics about chest, heart and stroke conditions.
The most up-to-date, available, statistics about chest, heart and stroke conditions.